Keeping track of how a business is spending money is very important for proper functioning of the business. EasyReports Power BI offering provides a standard dashboard for Tally users allowing them to analyze data by expense category,
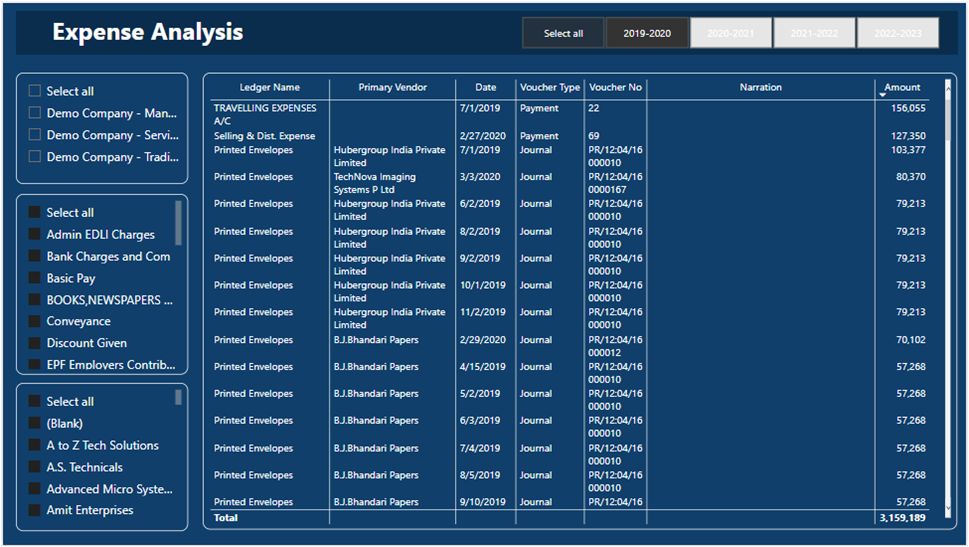
month and even deep dive into transaction level details.
“Data analytics is the future, and the future is NOW! Every mouse click, keyboard button press, swipe or tap is used to shape business decisions. Everything is about data these days. Data is information, and information is power.” - Radi, data analyst at CENTOGENE
Challenges in Expense
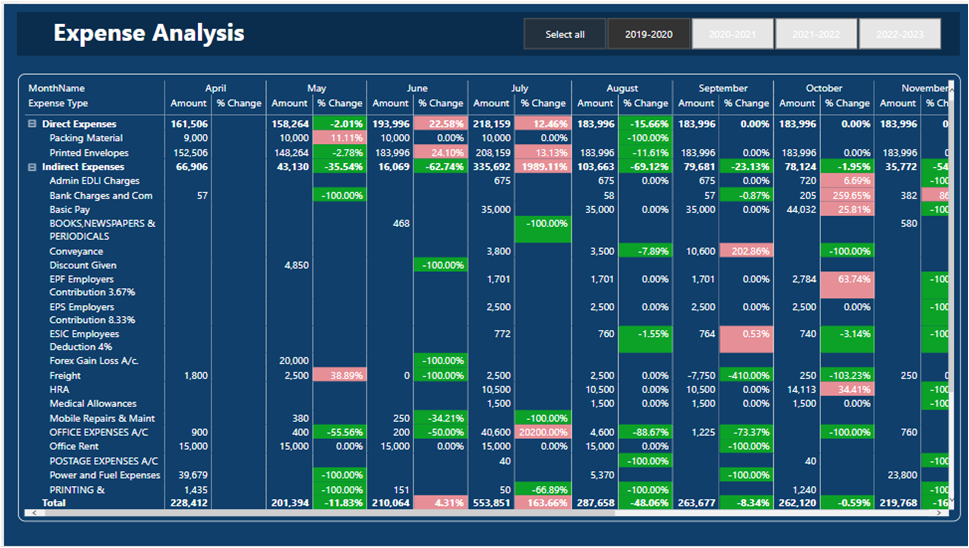
Tracking expense variations
Difficulty in getting vendor wise expense tracking
Maintaining expense within limits
Identifying sudden increase in certain expenses
Major expenses of company
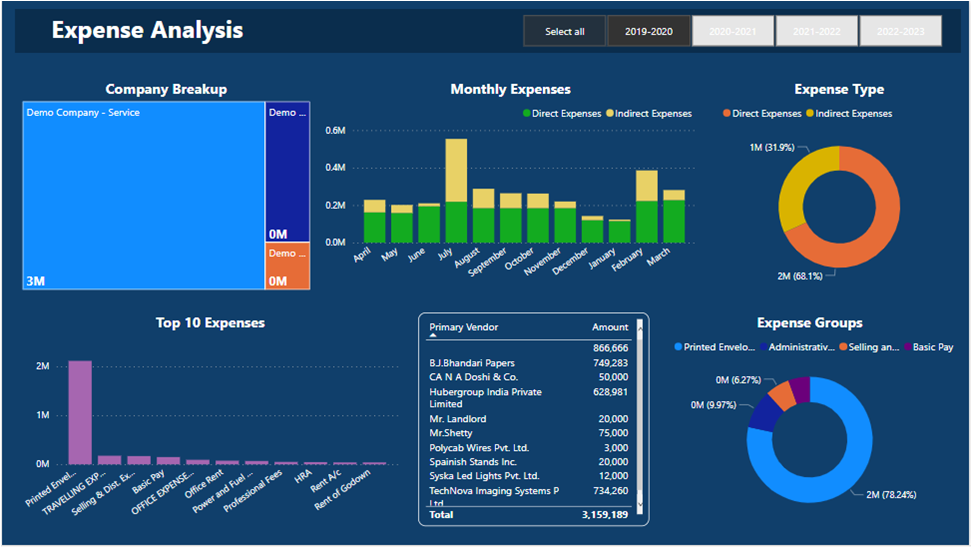
Expense Dashboard Features & Benefits
Top 10 expense – month, company, group
Expense mix – Direct, Indirect
Expense head wise percentage
Monthly expense variations – highlighting change from previous month