- contact@easyreports.in
- 8 Circus Market Place, Kolkata, India
Sales Dashboard
Quick Links

Get a free trial of PowerBI for Tally
Sales Dashboard
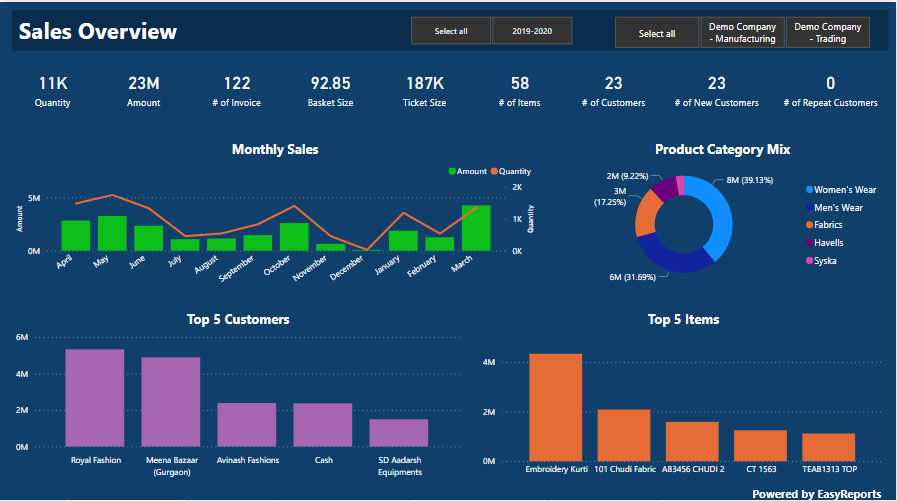
Sales is the primary driver of any business. Keeping control over sales performance is critical to achieving your goals. EasyReports' PowerBI offering provides a standard dashboard for Tally users covering the most important Sales KPIs and allowing you to explore your sales data with ease.
“Sales enablement can’t be reactive. It has to be a full-blown strategy that’s woven into the fabric of the company.” – Roderick Jefferson
Challenges in Sales
- Identifying inactive customers and items
- Identifying cross selling opportunities
- Tracking target vs actuals
- Managing salesperson performance
- Getting sales history of a customer and pitching the right product at right price
- Tracking new customers
Sales Dashboard Features & Benefits
- Get list of all inactive customers along with their sales history to reactivate them by pitching the right product at right price
-
View data by multiple dimensions:
Select a party and see items wise details along with monthly sales trend OR
Select an item and see party wise details along with monthly trend - Get top customers for a particular item or vice-versa
-
Track salesperson performance using the following KPIs:
- Number of new customers vs repeat customers
- Average Ticket Size
- Average Basket Size
- Rate vs Quantity comparison – Identify instances with low Rate and low Quantity
- Customer level or item level analysis using all the above matrices -
Further possibilities:
- Target vs Actual on any dimension
- Additional dimensions in your dashboard - region, zone, channel, segment, sales hierarchy, etc.


