

In today’s dynamic business landscape, effective expense management is crucial for maintaining financial health and achieving sustainable growth. Businesses of all sizes grapple with the challenge of optimizing expenditures while ensuring profitability. Luckily, modern technological advancements offer powerful tools like Power BI to streamline expense management processes.
The Significance of Expense Management
Expense management involves overseeing, controlling, and optimizing an organization’s spending. It encompasses various facets, including monitoring budgets, tracking expenses, analyzing spending patterns, and identifying cost-saving opportunities. Efficient expense management not only aids in maintaining a healthy bottom line but also provides invaluable insights for informed decision-making.
Enter Power BI Dashboards
Power BI, a robust business analytics tool by Microsoft, empowers businesses to visualize and analyze data comprehensively. Its intuitive interface and extensive capabilities make it an ideal choice for expense management. By leveraging Power BI’s features, organizations can transform raw expense data into actionable insights through interactive and visually appealing dashboards.
Creating Comprehensive Expense Dashboards
- Data Integration: The first step involves aggregating data from diverse sources such as accounting software, ERP systems, spreadsheets, and receipts. Power BI allows seamless integration, enabling users to combine and clean data for analysis.
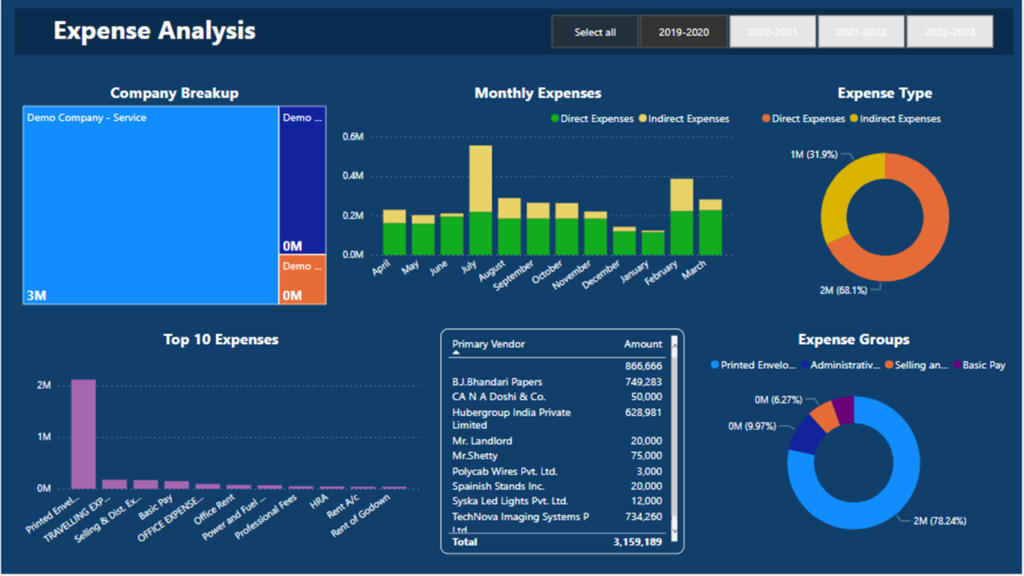
- Visualization: With a plethora of visualization options, Power BI enables the creation of visually compelling expense dashboards. Pie charts, bar graphs, heatmaps, and trendlines offer a comprehensive view of expenditure categories, vendor expenses, department-wise spending, and more.
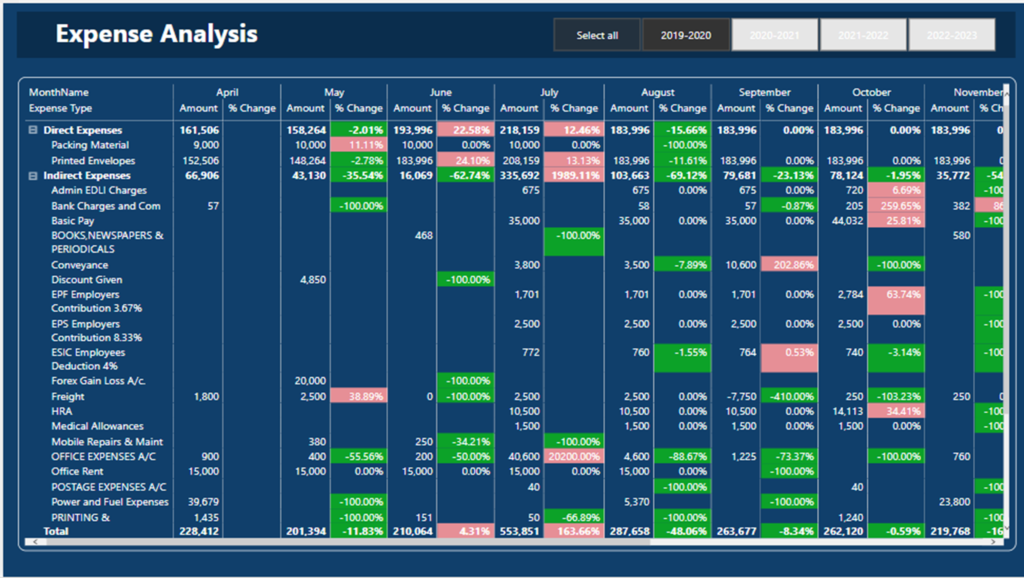
- Customization: Tailoring dashboards to specific business needs is where Power BI truly shines. Users can customize dashboards by applying filters, creating calculated fields, and adding drill-down functionalities to delve deeper into expense details.
- Real-time Monitoring: Power BI facilitates real-time monitoring of expenses. Automated data refresh capabilities ensure that the dashboards reflect the most current information, enabling timely decision-making.
- Predictive Analytics: Advanced features like predictive analytics in Power BI can forecast future expenses based on historical data. This enables proactive planning and budgeting strategies.
Key Benefits of Power BI Dashboards for Expense Management
- Enhanced Visibility: Visual representations of expenses offer a clear understanding of spending patterns, aiding in identifying areas of overspending or potential savings.
- Improved Decision-making: Access to real-time, actionable insights enables quicker and more informed decision-making regarding budget allocations and cost-cutting measures.
- Cost Efficiency: By identifying inefficiencies and optimizing spending, Power BI helps in reducing unnecessary expenses, ultimately boosting cost efficiency.
- Customized Reporting: Tailored reports and dashboards cater to specific organizational needs, ensuring relevant information is easily accessible to stakeholders.
Conclusion
In an era where data reigns supreme, leveraging tools like Power BI for expense management can be a game-changer for businesses. The ability to transform raw expense data into meaningful insights empowers organizations to make informed financial decisions, drive efficiencies, and achieve sustainable growth. With Power BI’s user-friendly interface and robust capabilities, mastering expense management becomes not just achievable but also an asset in fostering financial health and success.